Baltimore Crime Data Analysis
This is a statistical analysis of Crimes in Baltimore done on Kaggles. Here I show you a summary and a link to my kaggle account. I also included a Python/Jupyter notes PDF file.
In this Notebook I will analyse “Part1_Crime_Data.csv” dataset taken from Data Baltimore cityT. This dataset represents the location and characteristics of major (Part 1) crime against persons such as homicide, shooting, robbery, aggravated assault etc. within the City of Baltimore. Data is updated weekly. This is an exploratory analysis. The data was last updated May 17, 2023, the original csv file contains 565,726 records and 20 columns. Attributes (columns) : CCNO, CrimeDateTime, Location, Description, Inside_Outside, Weapon, Post, Gender, Age, Race, Ethnicity, District, Neighborhood, Latitude, Longitude, Geolocation, Premise, Total_incidents,
Here below is the link to my kaggle analysis : CRIMES IN BALTIMORE KAGGLE PROJECT
Crimes in Baltimore conclusion analysis
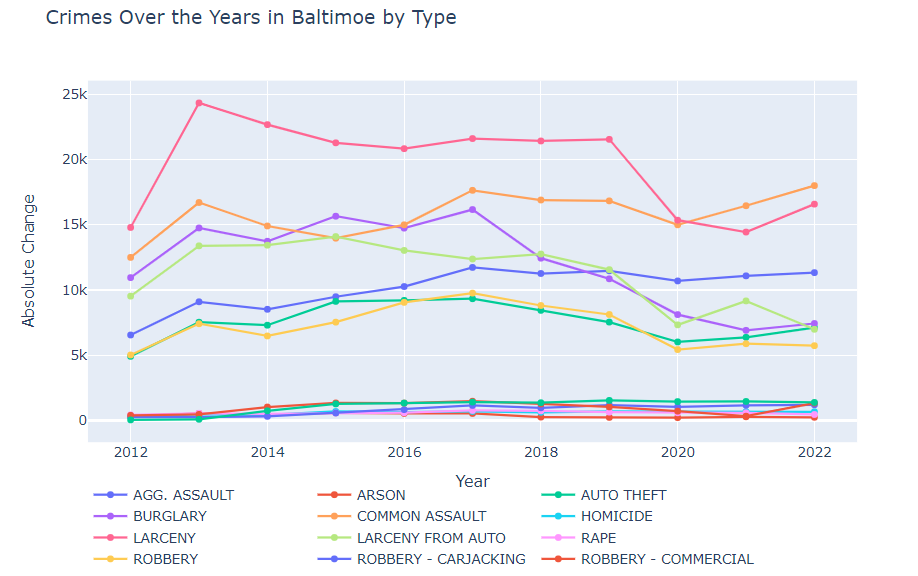
Baltimore dataset contains data starting from the 1960’s, however the entries don’t seem consistent (only a few in a total of half a million). The Data becomes more consistent from year 2012, however data is incomplete for 2023 (since the year isn’t finished). Therefore the analysis is from 2012 to 2013. Baltimore crime data shows that specific types of crimes are more ‘popular’ regardless of the year, namely Larceny, Common Assault and Burglary. While others are less ‘popular’ regardless of the year, namely Homicide, Rape and Arson. Larceny and Larceny from auto both show a downward trend. Aggregated assault and homicide seem to follow the same upward trend. Robbery and rape both reached a peak in 2017. Shooting increased sharply from 2012 to 2015, then from 2015 it steadily goes up. Frankford is the city with the highest crime level while the district with the highest level of crime is southeast. However, when we look at the heatmap, no particular city or district stands out. From the above analysis we find that Larcency, common assault and Agg. Assault are the 3 most common crimes around the most dense crime location (based on latitude and longitude). When it comes to the average time when crimes where pertpetuated, we see that it varies depending on the year. The only pattern noticeable is that crimes tend to happen between the afternoon (from 15h) to midnight. I performed a simple regression with the years as the dependent value and number of crimes per type of crime as the independant value. I then predicted the number of crimes for 2023 and compared the results with the 2023 data we had previously (by doubling the number of crimes for 2023). I concluded that the results are off, and that a deeper analysis should be done if we want to forecast the number of crimes (ex.: use of time series). I also checked if race, age or gender has an impact on the type of crime by performing a chi2_contigency test and concluded it does. Further analysis would need to be done to see what are exactly the differences.
Below is a PDF version of my kaggle project